Covid-19 has brought statistical concepts and terms into the news as never before. One confusing tangle is the array of terms surrounding diagnostic test results. The most basic is accuracy – what percent of test results are correct. This is not necessarily the most important metric, however, and it’s limitations have given rise to a variety of other metrics – sensitivity, specificity, recall, precision, false positives, false negatives, and more. Let’s untangle them.
There are four conditions arising from testing for a specific disease:
- Disease present or not
- Test positive or not
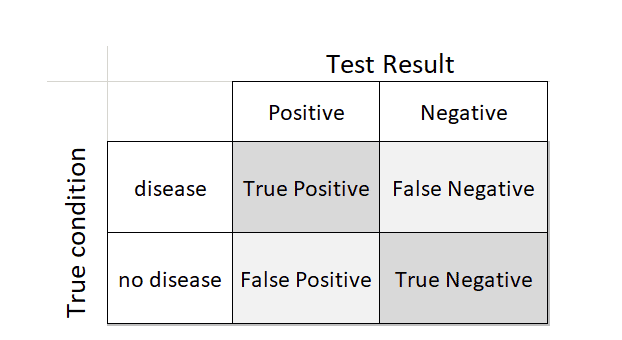
A person could have the disease and the test could be either positive or (erroneously) negative. Likewise, a person could not have the disease and the test could either be (erroneously) positive or negative. These four possibilities are summed up in a 2×2 table:
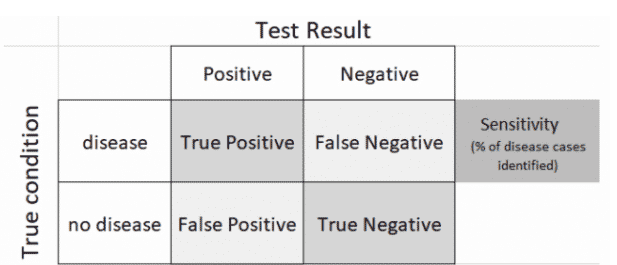
The characteristics and performance of a diagnostic test can be measured from this table. Health professionals typically focus on how well a test identifies disease cases (sensitivity). They also do not want too many false positives.
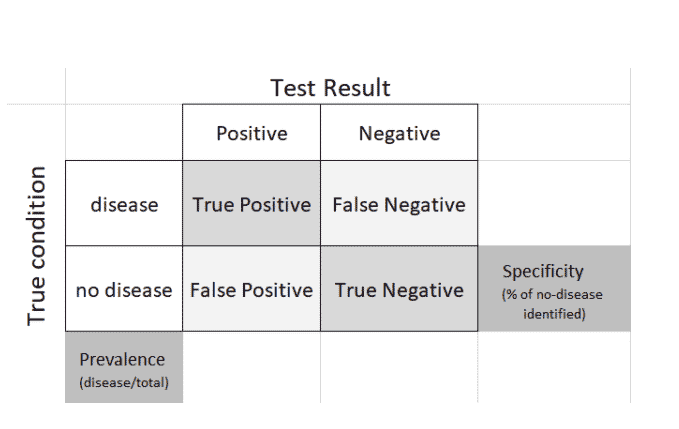
A third metric – specificity – measures the ability of a test to correctly label the no-disease cases, while prevalence indicates the proportion of people who have the disease.
Note that a test can have high sensitivity and high specificity, and still generate huge numbers of false negatives and false positives.
Consider two scenarios:
- Widespread testing for a rare disease (low prevalence). In this case, the no-disease false positives swamp the yes-disease true positives. Sensitivity can still be close to 100%, yet you have little confidence in a “positive” test result.
- Widespread disease. In this case, the yes-disease false negatives can be large in absolute number. Why is this important?
Situation 2 is where we now find ourselves with Covid-19, where we have no vaccine and very limited proven treatments. The main concern is infectious spread. Confirmed cases in the US number over 1.1 million, but this is but the tip of the iceberg. Asymptomatic cases are probably several times that number, and the primary public health strategy is shifting towards protecting the most vulnerable from those who carry the infection. High false negatives on antibody tests would vitiate that strategy – large numbers of people will circulate in society wrongly thinking they have already had the disease and are not able to transmit it. They will also compromise estimates of how widely the disease has spread.
Example: Suppose you have a Covid-19 antibody test with 95% specificity (the FDA minimum for test approval), applied widely to a population where Covid-19 is quite prevalent – say 10% of the population is infected. Consider 1000 people, and let’s say the test captures all 100 positive cases (100% sensitivity). Of the 900 true negative cases, the test correctly identifies 95% as negative, but 45 (5%) are falsely identified as positive. So 145 people in total are identified as positive and presumably immune, but 45 (31%) of them are not. Unfortunately, after the test, these 31% are told they are immune, and are all set to go visit grandma in the retirement home.
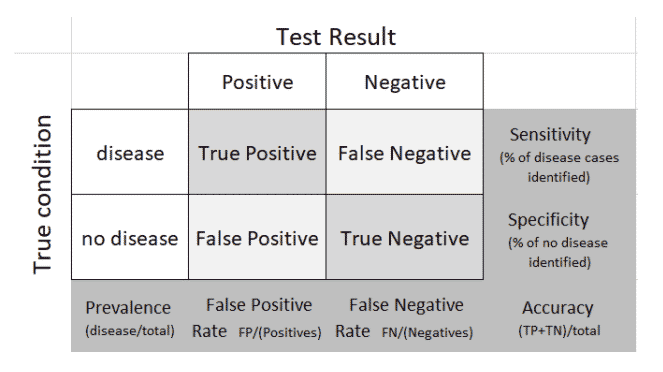
Let’s complete the 2×2 table with all the marginal terms:
There are dozens of Covid-19 tests in the works, both for active presence of the virus and for prior infection. They are used for diagnosis or surveillance; a list of those approved and in the works can be seen here. In considering results from these tests, you often see uncertainty intervals attached – these intervals typically incorporate calculations based on sensitivity and specificity.
Even for experienced statisticians, the definitions of sensitivity and specify do not come trippingly off the tongue – see this blog by Andrew Gelman. The importance of the metrics can be seen in the paper COVID-19 Antibody Seroprevalence in Santa Clara County, California by Bendavid et al, which received a lot of press and also criticism, much of it centering around the roles of test sensitivity and specificity (addressed in version 2 of the paper).
Addendum: Predictive Modeling Counterpart
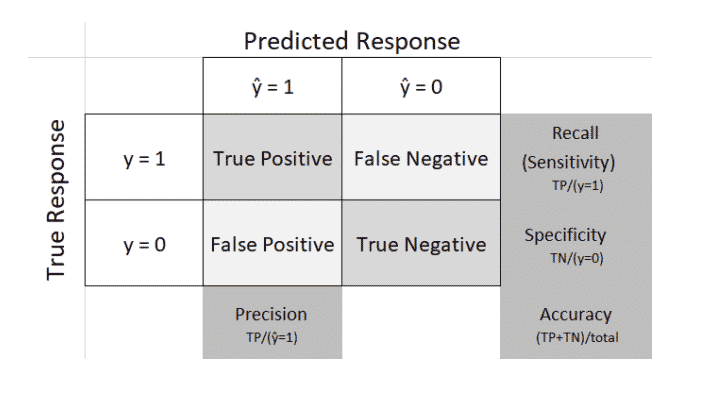
To make matters more confusing, the same concepts are used in predictive modeling. Instead of a diagnostic test to signal whether someone has a disease or not, we have a predictive model to classify a record as a 0 or a 1 – fraud or not-fraud, buy or don’t buy, etc. Terminology is slightly different, as follows:
- Data scientists generally use “recall” instead of “sensitivity” (the meaning is the same)
- Data scientists also refer to “precision” – the proportion of predicted 1s that are actually 1s
Here is the predictive modeling counterpart to the above tables. In this context the table is called a “confusion matrix,”
